Sales Funnel Strategy: Bottom Up Assumptions
Nov 2, 2023

The preferred method for estimating sales consists of focusing on the underlying components that drive customer acquisition and conversions. This method, which I refer to as the "Bottom-up" approach, takes more time to establish than the top-down approach but it has the potential to produce the most accurate outcomes and will almost certainly help you build an effective strategy for getting your product or service to market.
The Startup Virtue model includes six sales funnel modules that you can activate or deactivate to create your unique sales approach. Those five funnels are:
Website / Organic Sales - Sales from website visits driven by content marketing, social media engagement, SEO, events, etc.
Waitlist Sales - Sales you can predict based on the number of users on a waitlist to purchase your product/service as soon as it launches or otherwise becomes available for sale.
Founder-Led Sales - Sales completed by founders themselves. This is common for early-stage companies that are looking to acquire their first customers.
Paid Ad Campaign Sales - Sales you generate through purchasing paid ads.
Direct Sales - Sales generated through a dedicated sales team. This is common for B2B SaaS applications. Note that you will need to add sales staff to your Hiring Plan before this module can predict sales.
Channel Partner / Affiliate Sales - Sales generated through channel partners, including wholesale buyers, distributors, influencers, or resellers.
Note that, for marketplace businesses, these sales funnels drive the acquisition of sellers to your marketplace.
Start by checking the box to activate the bottom-up sales assumptions feature.
Website Traffic and Organic Sales Assumptions
Set the number of unique website visitors to your website that are driven by social media, SEO, events, or content marketing. Numbers here represent organic website traffic that is not driven by paid ads or affiliates (we will handle these in the sections below). The total number of unique site visitors will drive your organic sales and revenue from ads and data sales (activated in the Setting Up Your Revenue Model section).
Start by setting the number of unique website visitors to your site when it launches. Let's say you've generated some excitement on social media prior to launching your product and you can expect 1000 unique website visitors to your website in the first month you turn it on. Next, set the month in which you launch your website. For example, month 6.

Next, set the percent growth in unique site visitors you can expect each month. Set this figure for each year in the model. Adjusting these variables will change the total number of unique site visitors calculated in each year.
If you are converting customers via organic website traffic, activate the website sales funnel by checking the box next to "Use your Website to Acquire Customers".

Next, set the conversion rate for turning website visitors into customers (or trial users if you have a SaaS business). Then set a monthly website spend amount you expect will be required to achieve the rate of website traffic and conversions you set above. Add a growth rate to your website spend, if needed.
They grey calculated fields will reflect an annual summary of your website traffic, conversions and CAC. Adjust any variable in this section to change the outcomes.
Waitlist Sales Assumptions
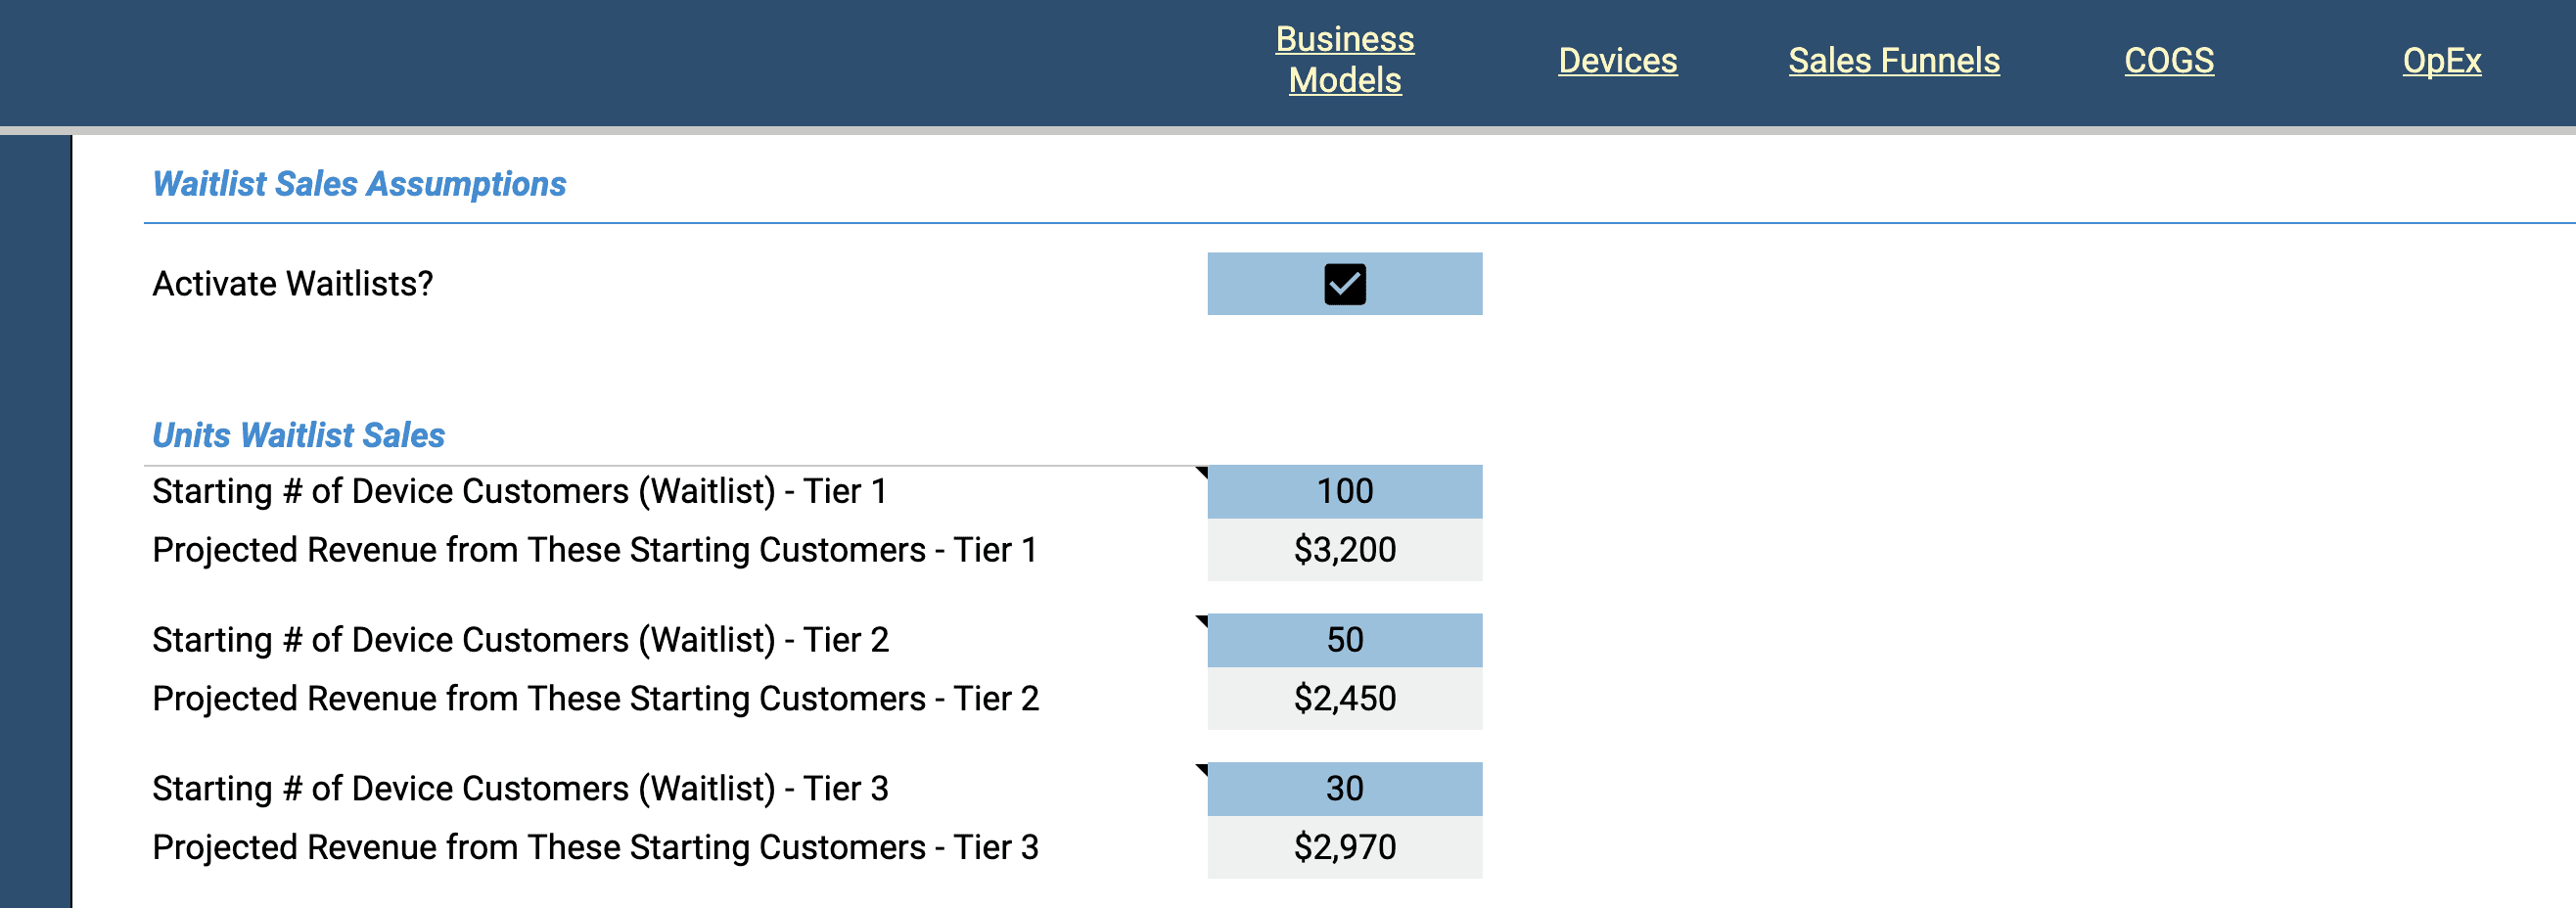
The waitlist feature is designed to account for prospective customers who join a mailing list, newsletter, or social media group, signifying their intent to purchase your product or service before it is available for purchase. Activating the waitlist feature allows you to input the number of sales you are likely to make upon launch of your offering(s).
Activate the waitlists feature and set the number of customers you expect to convert, by tier, in the first month each offering becomes available for sale. The grey calculated fields show the projected revenue, by tier, from the starting number of customers you set in the blue boxes.

The waitlist fields for physical goods and transaction is the same. The waitlist fields for subscription offerings works a bit differently depending on whether you offer trial periods.
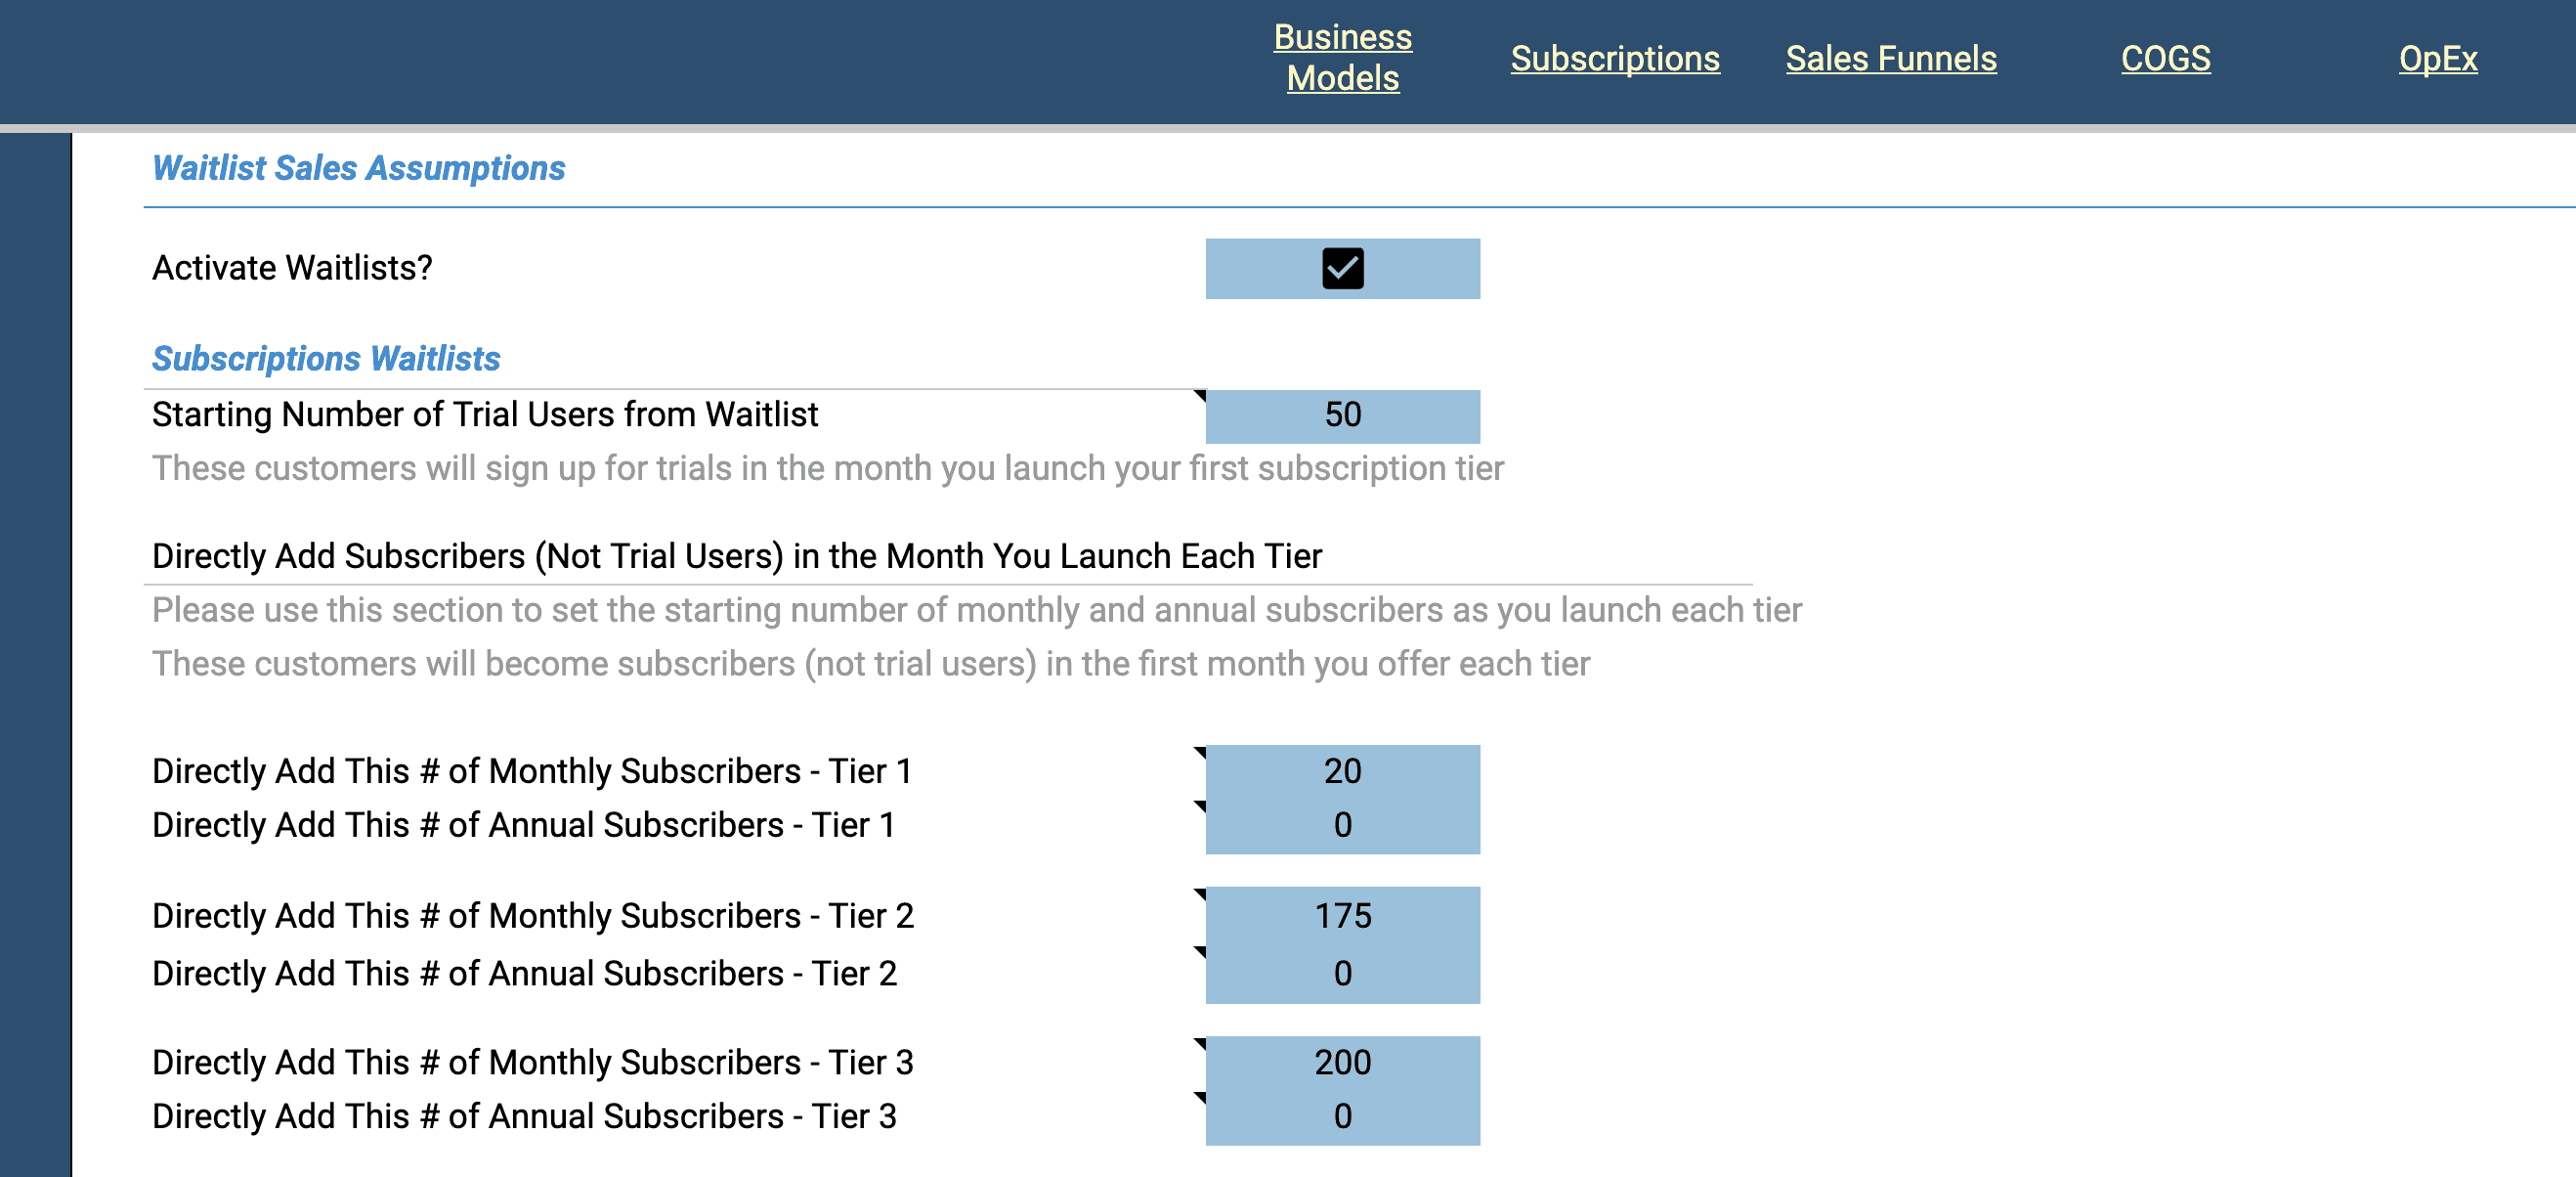
If your subscription offering includes a trial period, you have the option to enter a starting number of trial users and/or a starting number of subscribers.

The number of trials you enter will be activated in the first month that your first subscription tier becomes active. Note that only some of your trial users will convert to paying subscribers depending on the trial conversion rate you set in the subscriptions section of the model. Those who convert will be allocated across any tiers available in the month your first tier launches. The number of trial users that convert will be allocated to monthly vs. annual according to your settings in the subscriptions section of the model.
Alternatively, you can directly add the number of monthly or annual subscribers by tier.
Founder-Led Sales
The founder-led sales feature represents a simple method to account for sales generated by a founder through personal networking, trade shows, conferences, or other engagements with clients.

First, enter the number of founders who are engaged in direct sales and the month when those founders begin making sales. For each year, enter the average number of sales each founder is expected to complete per month. The model will calculate implied annual and monthly revenue based on the number of sales per month and the assumptions in the subscriptions section.
Paid Ad Campaign Sales
Leveraging paid ads is a popular way to drive sales once you identify your target market. Check the box to "Run Paid Ads to Acquire Customers" and the Paid Ad feature will activate. Set the month when you plan to begin your first ad campaign.
Next, enter Cost per Click (CPC) rates and conversion rates. If you don't know what your CPC is likely to be, I recommend going to Google Keyword Planner to determine average CPC rates for they keywords you plan to use in your campaign.
Set the conversion rate (CVR). CVR is the percentage of prospective customers who purchase your product or service. If have the trial setting active for SaaS or subscriptions, this is the rate at which prospective customers sign on for a free trial. Conversions from trial to purchase are set in the subscriptions section.

In the next set of rows, the model calculates your implied customer acquisition cost (CAC) based on the CPC and CVR. If you have trials active, the model will also calculate the implied CAC for subscribers converting from trials based on the "CVR to Paid (Conversion Rate) from Trial Users" set in the subscriptions section.
Next, set the Ad Spend per Month over the next five years. Enter your average monthly spend across all paid ad channels (Google Ads, Facebook, Instagram, LinkedIn, etc). Optionally, you can set a month-over-month growth rate for paid ad spend.
The model will calculate your total ad spend, total site visits from paid ads, and total conversions (to purchase or trial) over the next five years.
Direct Sales
If you currently have or plan to set up a sales team for your product, select "Yes" in the dropdown next to "Will You Have a Sales Team?". Note that the settings for direct sals are driven by the number of sales people you enter into the Hiring Plan.
Under the Direct Sales Team Funnel Assumptions section, you will need to establish a ramp-up period between the month you hire a sales person and the month they begin meeting the sales quota you set for each year. To do this, set the number of months before each newly hired sales person makes their first sale. Then set the number of additional months it takes for each sales person to achieve the full quota after their first sale. These two numbers will define the ramp up period, which is shown in the very next row.

Next, set the monthly sales quota per sales person and the model will calculate implied monthly and annual revenue generated per sales person. Finally set the average commission (%) you will pay to each sales person. Note that the model classifies total sales commission as a cost in the income statement and it is calculated by multiplying the commission % by the total revenue generated by Direct Sales. Contact me if you need to customize the model for your unique sales compensation plan.
To complete the forecast for direct sales, don't forget to add sales people in the S&M section of the Hiring Plan.
Channel Partner / Affiliate Sales
If you sell a physical product to wholesale partners or you market your digital product or subscription using affiliates, activate this section and enter the start month for partner sales. Going forward, I'll refer to wholesalers, distributors, and affiliates (i.e. entities that sell for you) as "channel partners" or, just "partners".

Next, set the number of channel partners you work with in each given year. Unlike other rows in this section, the "Number of Partners" row defines the number of partners you obtain for that entire year—not per month.
Enter the average number of sales you expect each partner to generate per month within each year. If you are selling products in bulk, for example, to a grocery store or other distributor, enter the average number of units each partner purchases each month. If you are selling virtual products, services or subscriptions, enter the average number of sales that are driven by each channel partner per month. You can ramp up the number of sales per partner per month by entering a monthly growth rate.
If you sell physical goods, through channel partners or affiliates, you can enter a sales commission % paid on each transaction. Commission for channel partners is based on the gross market value (GMV) of each transaction — not the unit price. Given the nature of pricing for subscriptions and one-time transaction products, the commissions setting in this section does not apply to subscription- or transaction-style revenue models. Instead, you can input an average marketing spend per partner per month to reflect the cost of running an affiliate or referral program. Input a growth rate for this marketing spend, if applicable.
Note that marketing spend per partner per month also applies to revenue models involving physical goods.
Channel partner arrangements, referral programs and affiliate partnerships can include complex terms and, thus, involve more or different variables to forecast accurately. If you need assistance modeling your company's unique channel sales strategy, please contact me.
Other Revenue Assumptions
If you have other sources of revenue that are not covered in this tool, you can use this section to input monthly revenue earnings, along with a growth rate. If you do not have sources of revenue outside of the revenue models set up in the tool, make sure the assumptions in this section are all set to zero.
__________
If you are interested in comparing the performance of your sales funnel strategy to the Top-Down Target assumptions set in the previous section, continue to Sales Gap Between Top-Down vs. Bottom-Up Assumptions (this step is completely optional). If not, continue to the COGS for Virtual Products and SaaS or COGS for Physical Goods to set up your direct costs for delivering products and services. Or head back to the Guidance page.
